
See how impact capital flows across 10,000+ funders and companies → Explore the Ecosystem Map

The 2026 MFI Index

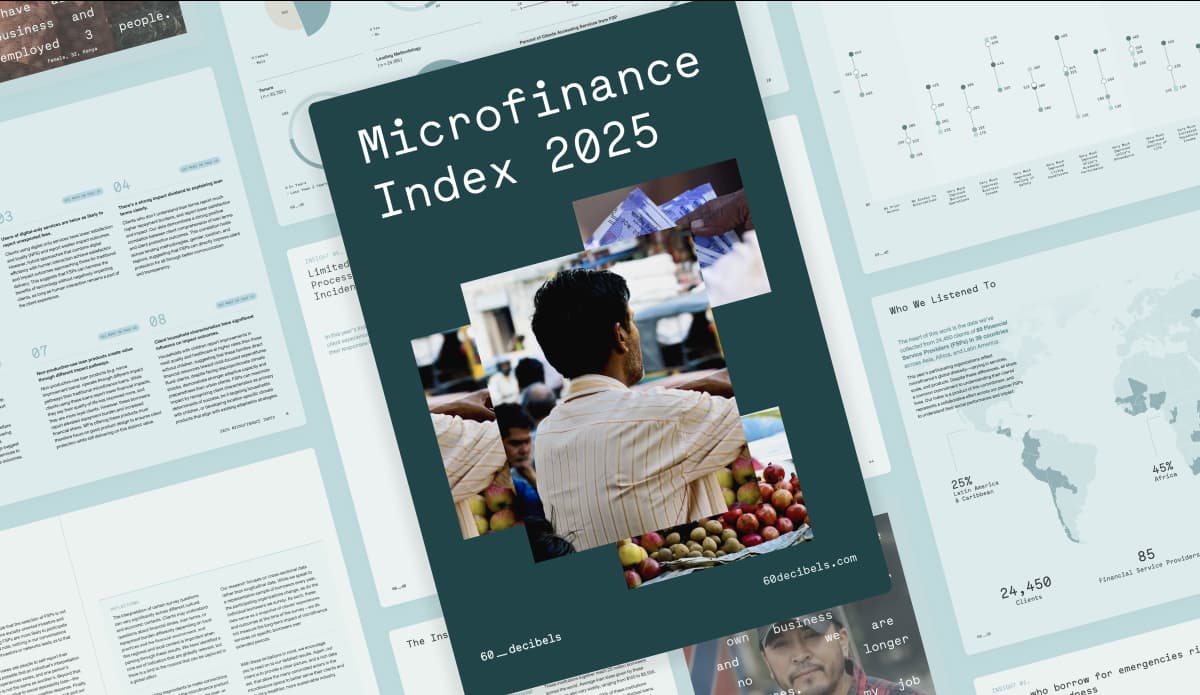
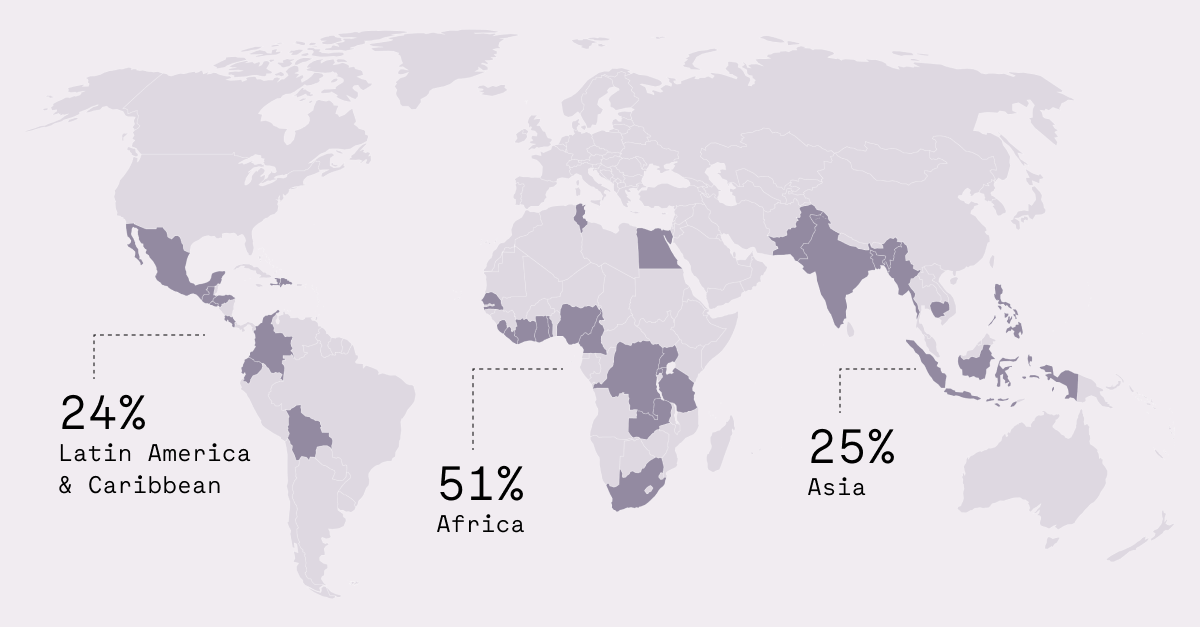
The 2026 Microfinance Index is built on interviews with 18,709 clients from 35 countries, representing approximately 22 million global microfinance borrowers.

65

Financial service providers

35

Countries

18,709

Microfinance clients

The 2026 MFI Index includes data from 65 participating financial service providers (FSPs) and is supported by 15 Partners. Now in its fifth year, the 2026 Microfinance Index has surveyed 18,700+ microfinance clients in 35 countries representing 22 million people globally. This year’s survey gathers quantitative and qualitative data along six key dimensions of impact, including Access, Loan Product Impact, Household Impact, Client Protection, Resilience, and Agency.

Download the 2026 Microfinance Index report
Download

“My business has helped me afford paying my children’s school fees. I managed to buy four more sewing machines, and they have helped me increase my income. I even bought a plot of land.”

Female, 54

“As I increased my investment in my business, my income went up. Achieving financial stability is the key to making everything else work out.”

Female, 35

“My quality of life has improved because, despite the country’s economic reality, the loan has helped me by allowing me to buy more products so I can sell much more.”

Male, 35

“My wife was ill, and she had to undergo an operation. At that time, I received the money, because of which my wife’s treatment was done properly and now she is fine.”

Male, 39

“The loan is available immediately and reaches us on time, and my members are very kind. I was already a member long before and the benefits and insurance are truly great.”

Female, 60

2026 Headlines

  • Women consistently report stronger outcomes than men, but that difference might be driven by product and institutional characteristics

    This year, as in years past, outcomes for women are higher than for men on nearly every measure the Index captures, from quality of life to confidence to repayment burden. However, deeper analysis reveals that the gap disappears when we control for lending model, loan type, and client profile. When we compare women and men with similar profiles and similar loans, their reported impact is nearly identical. The one metric that doesn’t follow this pattern is satisfaction: women rate their FSPs 12 to 24 NPS points higher than comparable men in every comparison we run.

  • Women and men invest in their businesses at similar rates. The difference: men’s loans are twice the size of women’s, and men invest in equipment more often

    Women and men use productive-use loans for business purposes at nearly identical rates: 92% of women, versus 94% of men. However, women’s loans are half the size of men’s: the median is $1,744 vs. $3,332 in purchasing-power terms. Women are more likely to invest in inventory, while men invest in machinery and equipment more often. Their different practices show up in different results. When asked about the impact of their loans, women talk about household welfare and bills, while men name the ability to afford assets and improve production. This raises an important measurement conundrum: measures of business income will more likely correlate with the activities men are taking with their larger loans.

  • A repayment flag means a struggling client, unless it covers the whole group

    A loan that is PAR30 means that the borrower is more than 30 days behind on a repayment. PAR30 is one of the most-watched numbers in microfinance, as well it should be: flagged clients report real distress, with quality of life 11 points lower in individual lending and 9 to 10 points lower in group lending. They are also three times as likely to report a heavy repayment burden. At six institutions in our sample, though, flagged clients look no different from anyone else. These are group lenders whose systems record repayment standing at the group level, so one member’s miss can flag everyone. Before comparing the flag across lenders, it is important to understand how each one produces it.

  • The group lending advantage persists in our data, but there is considerable variation underneath the headline

    Clients of group lending FSPs report stronger outcomes than individual lending FSPs across the board. But that is a comparison of different institutions, so the cleaner test is to look at the 24 FSPs within our sample who offer both group and individual loans. Among these, we find that group borrowers’ impact advantage shrinks or reverses. However, their protection advantage survives: fewer unexpected fees, fewer challenges, and marginally clearer terms. That edge comes from practices group lending builds in by default: terms explained in person, and staff who meet clients on a regular schedule. The good news for other providers is that most of these habits transfer. A lender using any model can build them deliberately.

  • Clients who get additional services with their loans report better outcomes, and the improvements grow with more services received

    Clients who receive additional services alongside their loan do better every year we measure it, and the advantage climbs in steps: quality of life improvement rises from 33% with credit alone to 36% with financial services such as savings and insurance, and to 45% once non-financial services like training and health support are also layered in. For FSPs looking to deepen benefit, adding complementary, high-quality wraparound services is the way to go.

  • Different loan types drive different quality of life improvements, but ‘productive’ and ‘non-productive’ categories tell us nothing about this

    Loans are conventionally sorted into productive use (funding something that earns) and non-productive use (everything else). Neither label tells you much about outcomes. On the non-productive side, 41% of housing loan clients report ‘very much improved’ quality of life and 47% ‘very much improved’ feeling of safety at home, the product’s core purpose. Their risk sits in repayment burden. Personal loans deliver weak impact and high burden: quality of life at 27%, heavy repayment burden double any other type’s rate. This is partly circumstance: 28% are unplanned, likely for emergencies. On the productive side, asset loans are meant for income generation yet their borrowers report the weakest quality of life results of any type: 23%. A portfolio judged on one average misreads its successes and misses where the strain sits.

  • Group lending’s impact advantage is largest where loans are smallest, which is where it was always meant to work

    We divide every loan in our sample into quartiles by size and compare results for group vs. individual borrowers. The result is a stark difference in outcomes for the smallest group loans, with this difference shrinking as loan sizes increase. Group borrowers in the bottom quartile report quality of life and business income improvements 18 and 17 points higher than the same quartile of individual borrowers. These gaps shrink in every quartile above. Surprisingly, satisfaction and loyalty show the opposite trend: NPS is 9 points higher for the bottom quartile of group borrowers compared to individual borrowers, but 24 points higher for the top quartile. The likely reason is that the support built around a group loan—the shared schedule and the regular contact—matters more as the obligation gets larger.

MFI Index Webinars

New Insights from the 2026 Microfinance Index

Register your spot

Perspectivas del Índice de Microfinanzas 2026

Reserva tu lugar

2026 Microfinance Social Impact Awards

Africa

1. Phakamani Foundation
2. BRAC Microfinance Sierra Leone
3. Grooming Centre

Asia

1. Cashpor
2. KOMIDA
3. Save Solutions

Latin America

1. Grameen Costa Rica
2. Avanza Sólido
3. Asodenic
Explore the Microfinance Social Impact Awards
Find out more

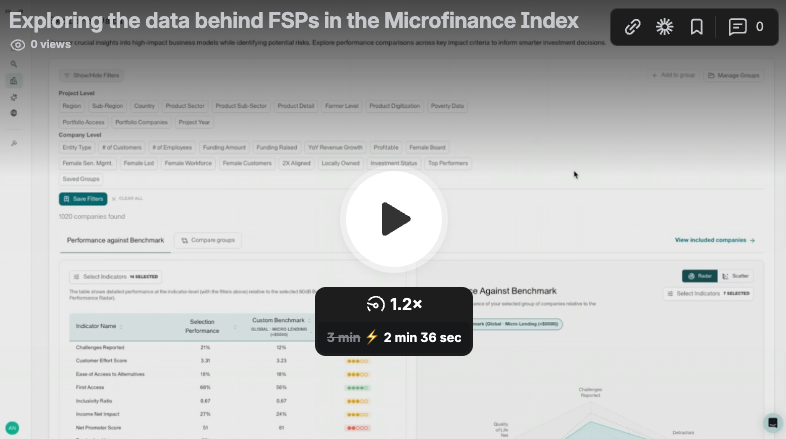
Get more out of the data with 60dB Signal

Take a closer look at the customer-reported data behind each FSP in the MFI Index
See example

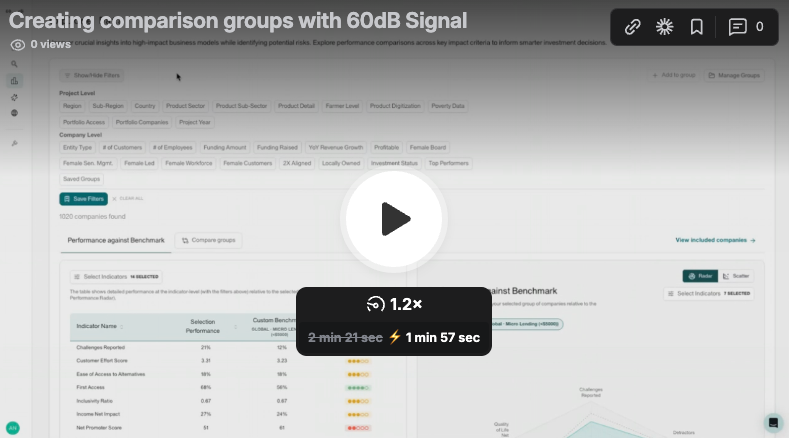
Spot trends between different group of FSPs such as East Africa vs West Africa
See example

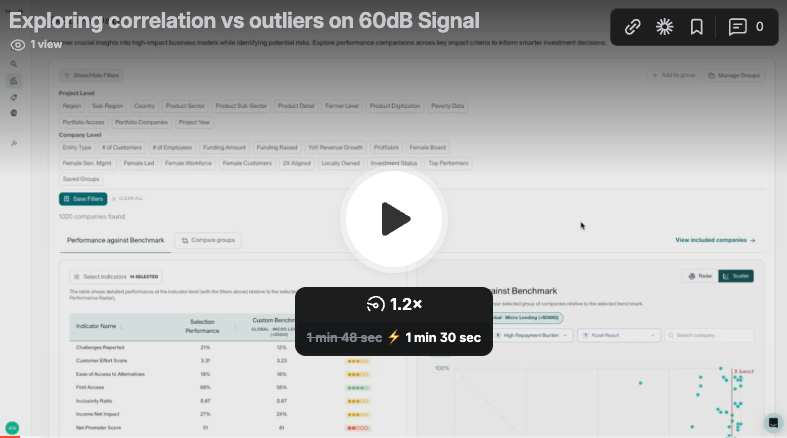
Spot trends between two indicators such as Repayment Burden vs Understanding of T&C’s
See example
Interested in taking part in 2027? Reach out to Pranav, our Financial Inclusion Lead
Get in touch

Latest Insights

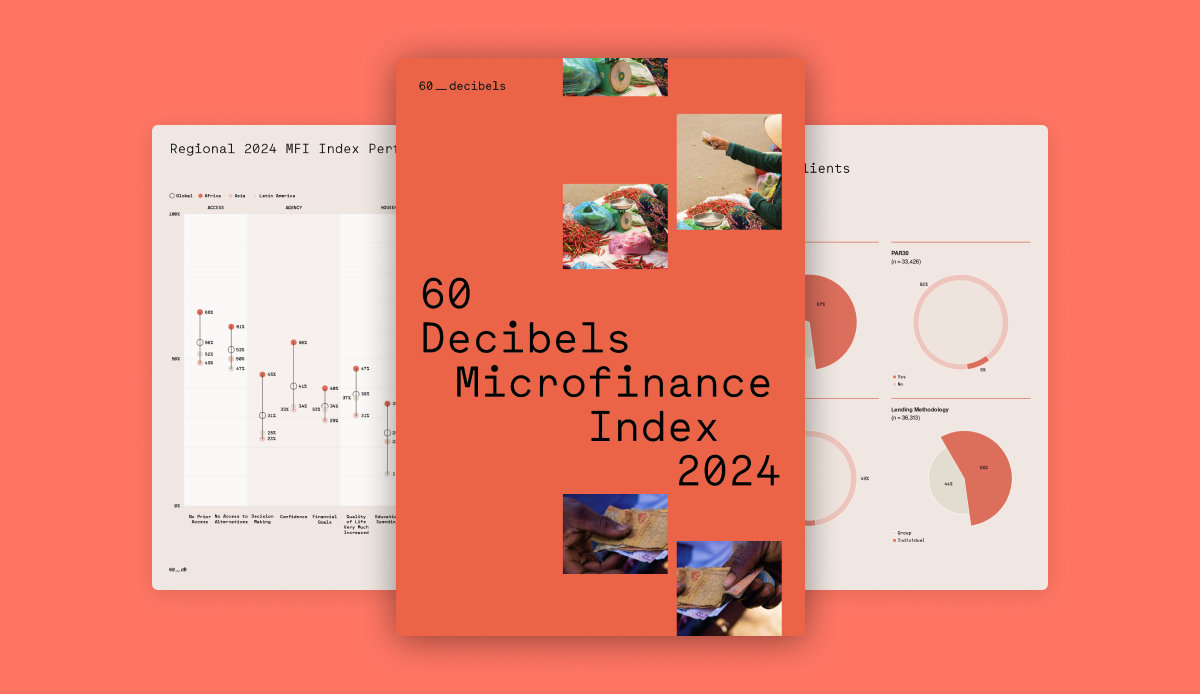
The 2024 MFI Index

The Microfinance Index is a landmark financial inclusion study that provides high-quality, comparable impact data for the microfinance industry, driven entirely by client voices. This annual initiative has expanded to collect more than 1.4 million unique global data points in 2024.
Read more

Let's talk

We help you understand your social performance by listening to your customers, suppliers, employees, or beneficiaries.
Get in touch

Quirky, informative, and a little bit nerdy - sign up for The Volume

Priority access to our favorite monthly finds, alongside 11,361 other data geeks

By signing up to the 60 Decibels mailing list, you consent to your data being collected and stored in line with our privacy policy