What’s Inside the Report?
This report distills years of interviews into meaningful insights on inclusion, quality of life, product experience, and more — helping organizations put the voices of those they serve at the center of their impact strategies.
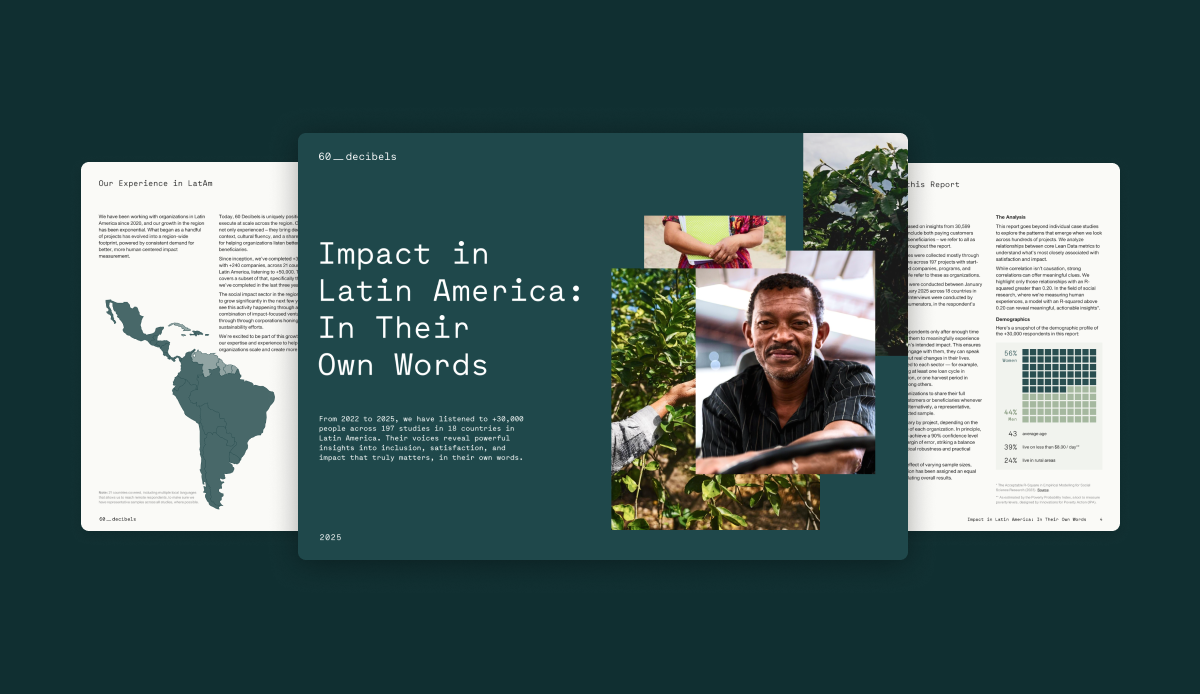
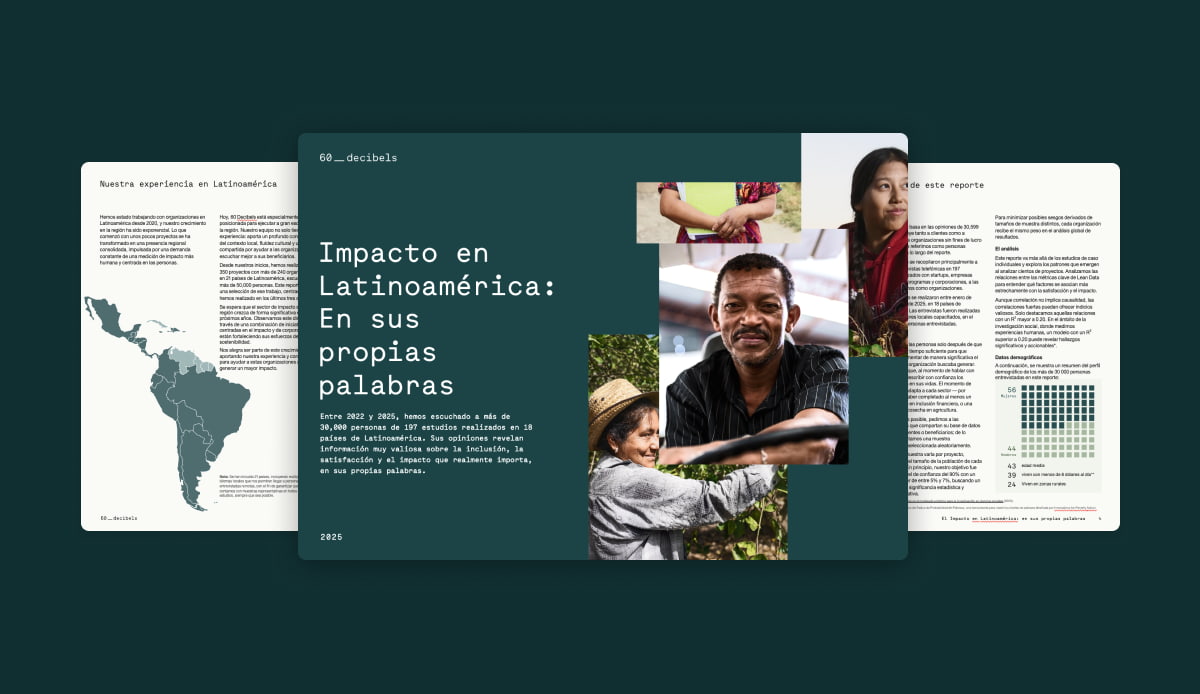
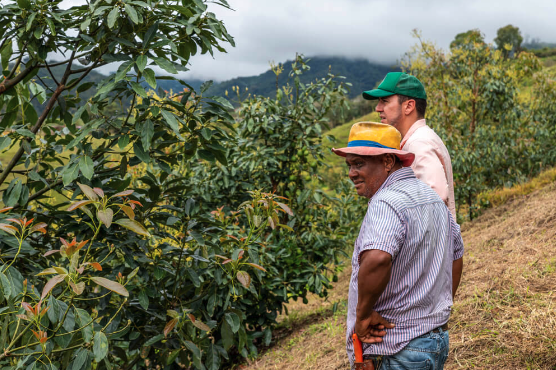
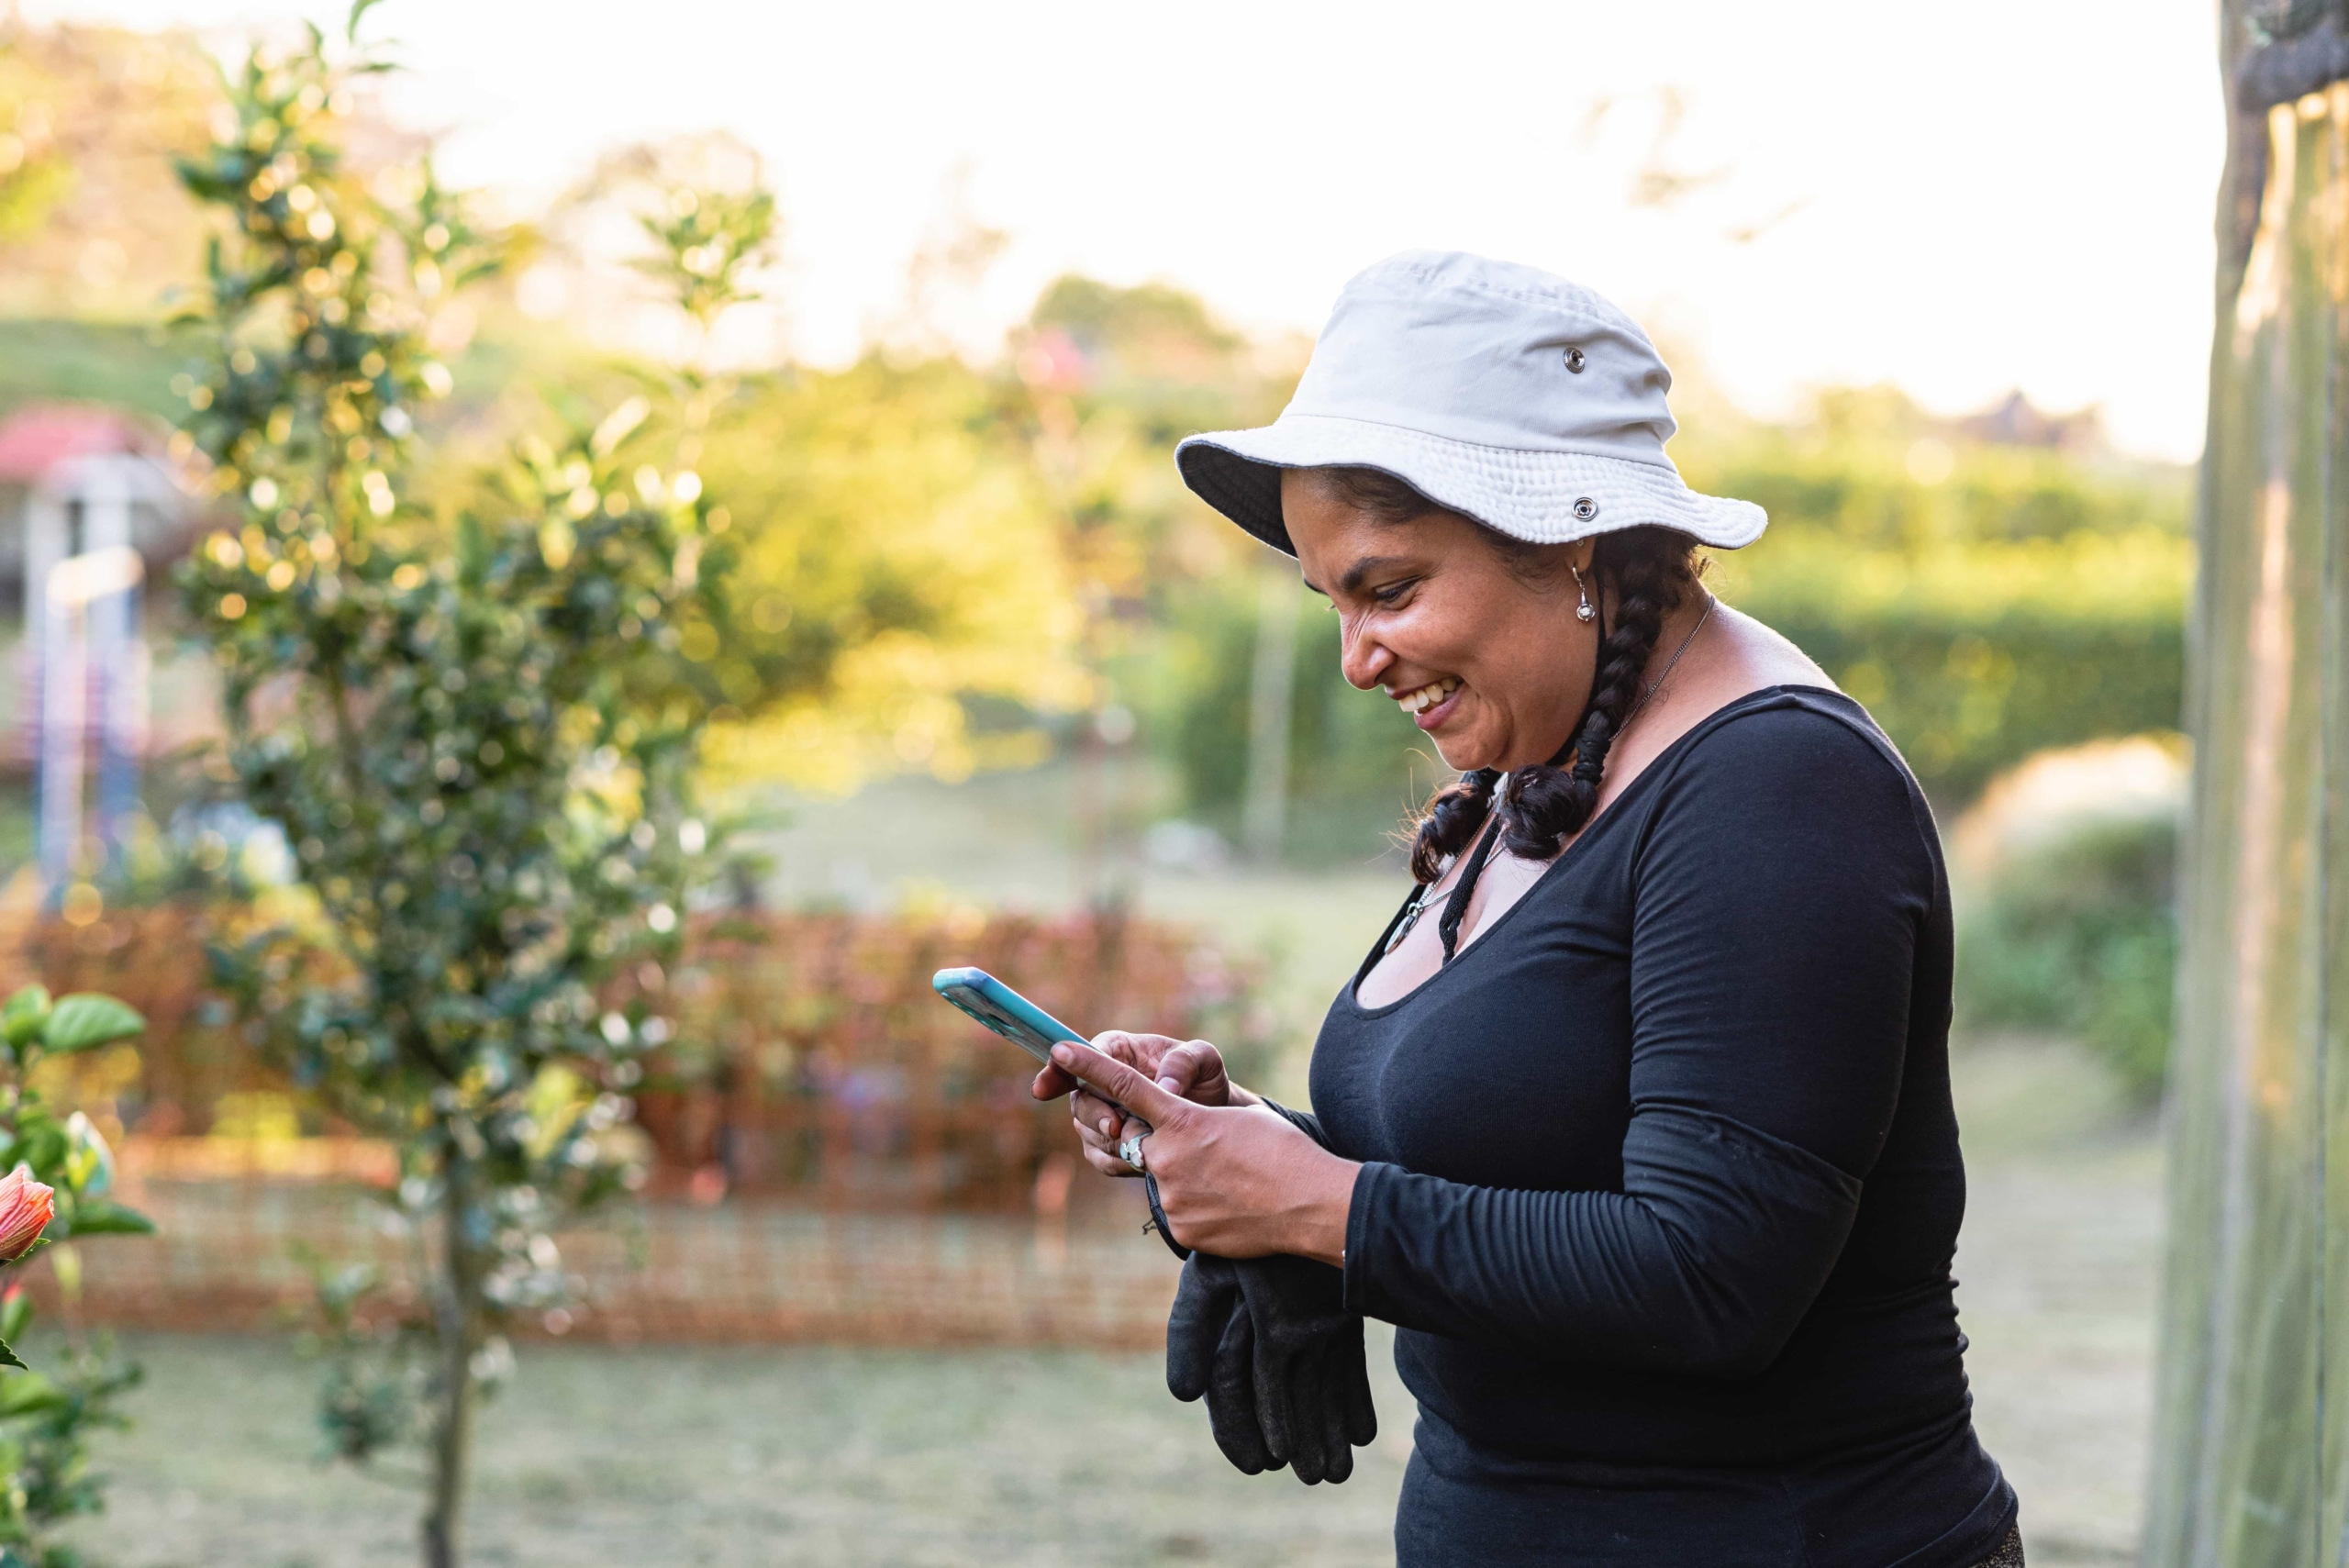
We heard from credit clients, urban entrepreneurs, rural farmers, low-income households, and many others. Their voices reflect urgent needs, transformative outcomes, and a growing demand for a more human-centered approach across Latin America.
The report takes two complementary approaches to help you understand impact in Latin America:
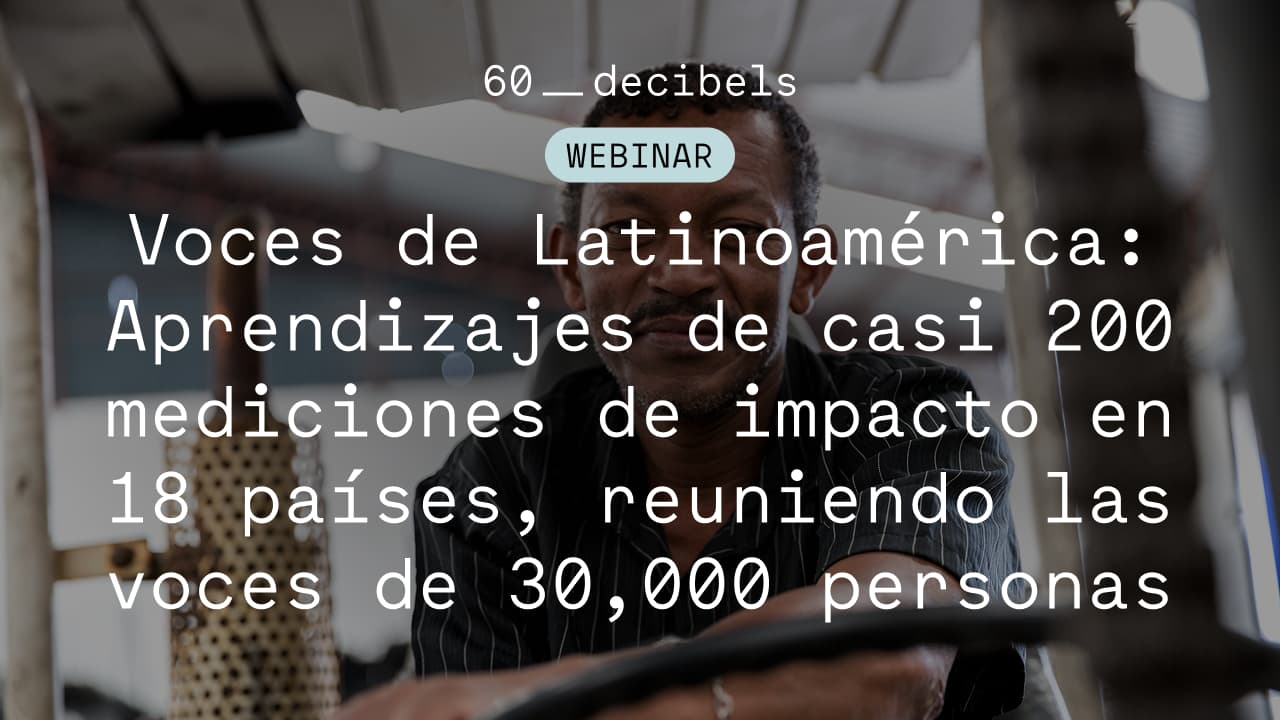
1. Benchmarking: What’s “normal” across the region? We averaged results from all 197 projects to share benchmark performance on key metrics across Latin America. These benchmarks help answer questions like:
- What proportion of people reached by the projects are living in vulnerable conditions?
- How many say their quality of life has improved because of the product or service?
- How can these benchmarks inform current performance and room for improvement?
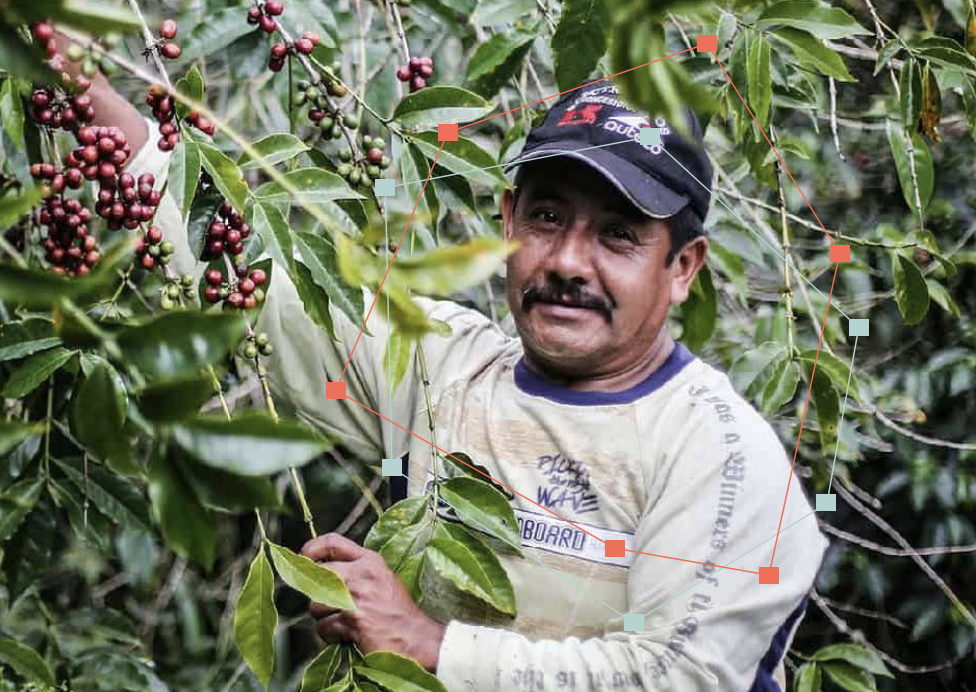
2. Connecting the Dots: How do impact outcomes relate to each other? We also explored the relationships between our standardized core impact metrics we track in every project. Some of the relationships might seem intuitive — but others aren’t. And even the intuitive ones deserve to be backed by data.
- Do first-time users also report fewer alternatives? Are impact-driven organizations truly reaching underserved populations?
- Can positive quality of life impacts drive customer loyalty?
- We ran correlation analyses to test these hypotheses — and the results were striking.